Classes | |
| class | Plot |
| Wraps gnuplot to plot stock data. More... | |
Functions | |
| Plot::Plot () | |
| Default constructor. | |
| Plot::Plot (std::string s, float time) | |
| Constructor. | |
| static float | Plot::get_time_in_weeks () |
| Getter. | |
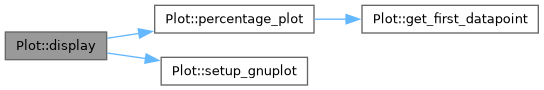
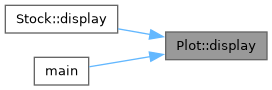
| void | Plot::display () const |
| Plot data for all stocks. | |
| void | Plot::display (std::string const &s) const |
| Plot data for a single stock. | |
| void | Plot::setup_gnuplot (Gnuplot &g) const |
| Setup options for gnuplot. | |
| void | Plot::process_data (std::string &s) const |
| Figure out which column to plot, comment out first row for gnuplot and remove all carriage returns. | |
| void | Plot::get_first_datapoint (Gnuplot &g, std::string const &file_name) const |
| Calculate furthest point back in time upto which to plot (time_in_weeks). The point is saved in a variable on the command line in gnuplot. | |
| void | Plot::percentage_plot (Gnuplot &g, std::string const &file_name, const Plot_type type) const |
| Plot data from time_in_weeks up until today. Oldest datapoint is normalized for all stocks. | |
| void | Plot::set_function (std::string const &function) |
| Set to daily / weekly / monthly data. | |
| void | Plot::create_temp_file (std::string const &data, std::string const &file_name) |
| Create a file to store stock data. Will be deleted at end of program. | |
| void | Plot::cleanup () const |
| Delete files storing stock data. | |
| Plot::~Plot () | |
| Destructor cleans up temporaray files storing stock data. | |
Detailed Description
Function Documentation
◆ cleanup()
| void Plot::cleanup | ( | ) | const |
Delete files storing stock data.
Here is the caller graph for this function:
◆ create_temp_file()
| void Plot::create_temp_file | ( | std::string const & | data, |
| std::string const & | file_name | ||
| ) |
Create a file to store stock data. Will be deleted at end of program.
- Parameters
-
data Stock data file_name File name
Here is the caller graph for this function:

◆ display() [1/2]
| void Plot::display | ( | ) | const |
Plot data for all stocks.
Here is the call graph for this function:
Here is the caller graph for this function:
◆ display() [2/2]
| void Plot::display | ( | std::string const & | s | ) | const |

◆ get_first_datapoint()
| void Plot::get_first_datapoint | ( | Gnuplot & | g, |
| std::string const & | file_name | ||
| ) | const |
Calculate furthest point back in time upto which to plot (time_in_weeks). The point is saved in a variable on the command line in gnuplot.
- Parameters
-
g Gnuplot object file_name File name containing data for a stock.
Here is the caller graph for this function:
◆ get_time_in_weeks()
|
static |
Getter.
- Returns
- time_in_weeks
Here is the caller graph for this function:

◆ percentage_plot()
| void Plot::percentage_plot | ( | Gnuplot & | g, |
| std::string const & | file_name, | ||
| const Plot_type | type | ||
| ) | const |
Plot data from time_in_weeks up until today. Oldest datapoint is normalized for all stocks.
- Parameters
-
g Gnuplot object file_name File name of data for a stock type First plot is created new, subsequent plots are redrawn on the first plot.
Here is the call graph for this function:

Here is the caller graph for this function:
◆ Plot() [1/2]
| Plot::Plot | ( | ) |
Default constructor.
◆ Plot() [2/2]
| Plot::Plot | ( | std::string | s, |
| float | time | ||
| ) |
Constructor.
- Parameters
-
s csv_column_name time time in weeks
◆ process_data()
| void Plot::process_data | ( | std::string & | s | ) | const |
Figure out which column to plot, comment out first row for gnuplot and remove all carriage returns.
- Parameters
-
s Stock data from csv file
Here is the caller graph for this function:

◆ set_function()
| void Plot::set_function | ( | std::string const & | function | ) |
Set to daily / weekly / monthly data.
- Parameters
-
function Daily / Weekly / Monthly
Here is the caller graph for this function:

◆ setup_gnuplot()
| void Plot::setup_gnuplot | ( | Gnuplot & | g | ) | const |
Setup options for gnuplot.
- Parameters
-
g Gnuplot object
Here is the caller graph for this function:

◆ ~Plot()
| Plot::~Plot | ( | ) |
Destructor cleans up temporaray files storing stock data.
Here is the call graph for this function: